Explore and inspect your Qlik Sense app or mashup from Google Chrome. Troubleshoot problems and monitor performance. No changes to your app or mashup needed.
Add Sense for Chrome works in both the build-in Sense client and in mashups using the Capabilities APIs
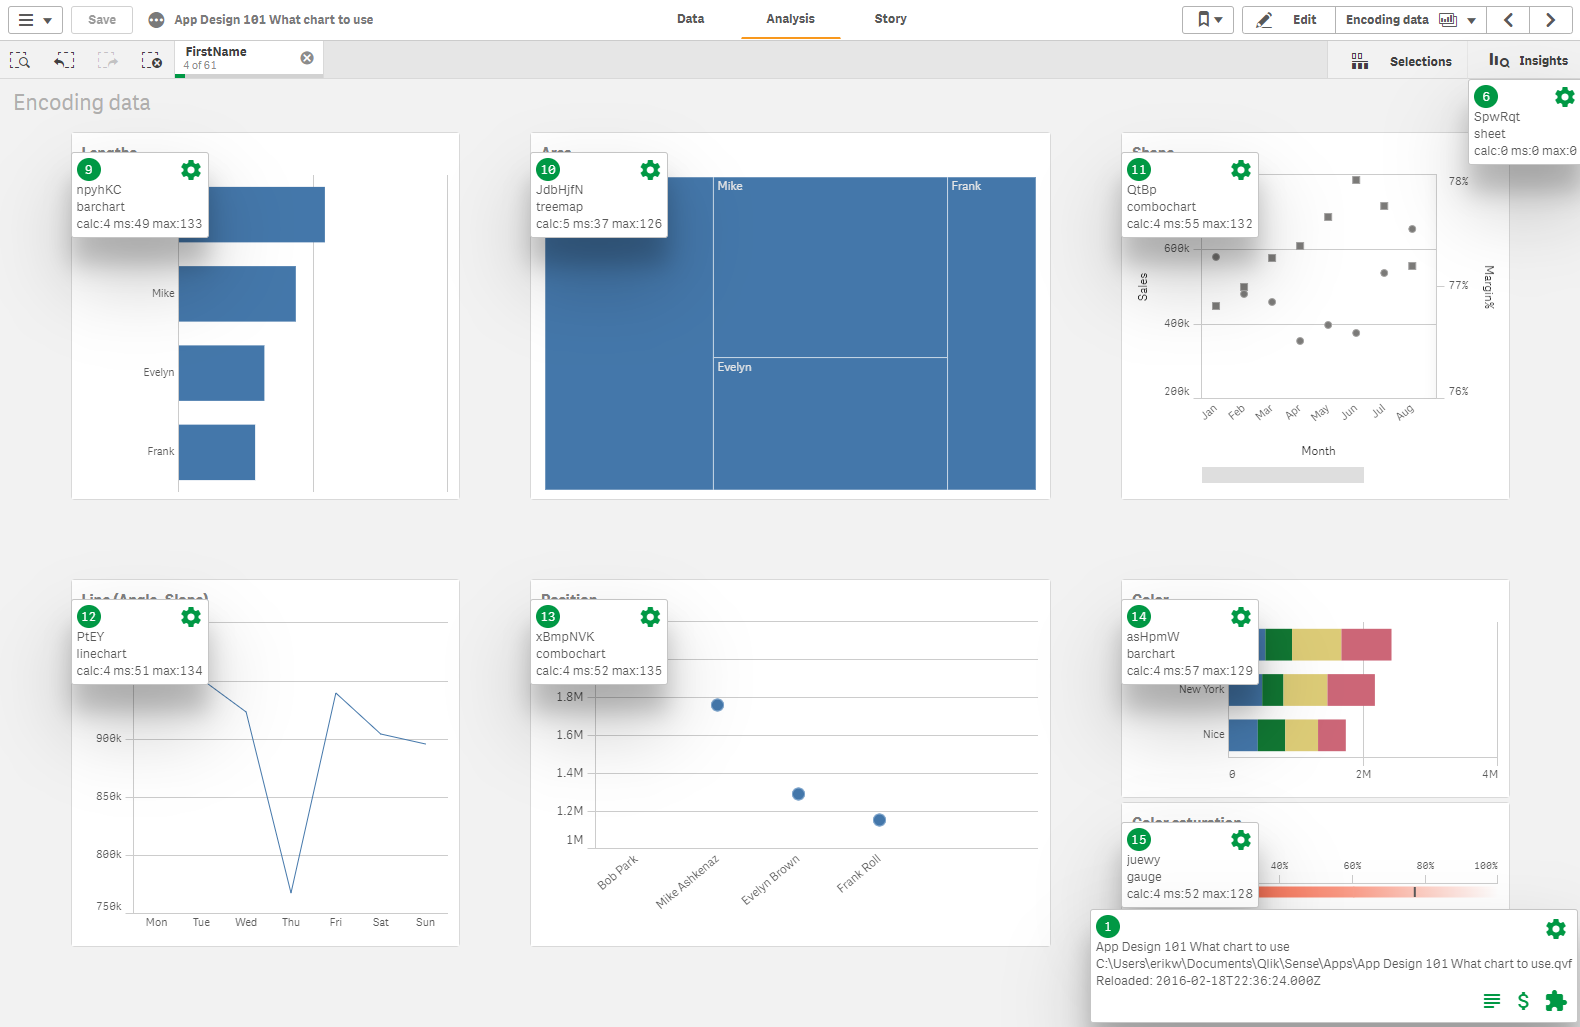
Charts displayed with the API through getObject and visualization.show will be tagged.
Used app(s) will be displayed in the bottom right corner.
Properties and other buttons will work just as in the client.
If your mashup shows charts from more than one app, all will be listed.


For all charts, sheets and the app you can click on the cogwheel.
That will display the properties for the object.
Use this to troubleshoot or to investigate what settings produce this chart.
You can display several objects properties at the same time, to make comparisons.
Properties can also be copied to clipboard.
From the app box you can inspect the script, variables and app properties.
Windows can be open at the same time and moved.
You can also copy window contents, complete or partly, to the clipboard.
If you do not have access to the script the script button will not be available.

You can also easily see what extensions and charts are used in your app.
Just click on the extensions button in the app info box.
You will get a list of all axtensions and built-in charts are used in your extension, with title and sheet title
Master objects are also included.

The extension can also help you find performance problems.
When you enable the extension on a page, whether it's the standard client or a mashup, it will start recording recalculation times.
Every time an object is revalidated then extension will register time elapsed for recalculation.
It will also count how many revalidations has occured.
If the object is no longer on the screen, the extension will continue to monitor recalculations, so when you re-enable it you will get all the statistics.
